VivaBoard AI turns raw HR data into clear, actionable intelligence. Upload a CSV from BambooHR, Workday, or any spreadsheet — our AI maps your columns in seconds and surfaces attrition risks, satisfaction drivers, and compensation gaps. Zero setup. Zero code.
From predicting who will leave next quarter to understanding what keeps your best people, VivaBoard covers the full HR analytics lifecycle.
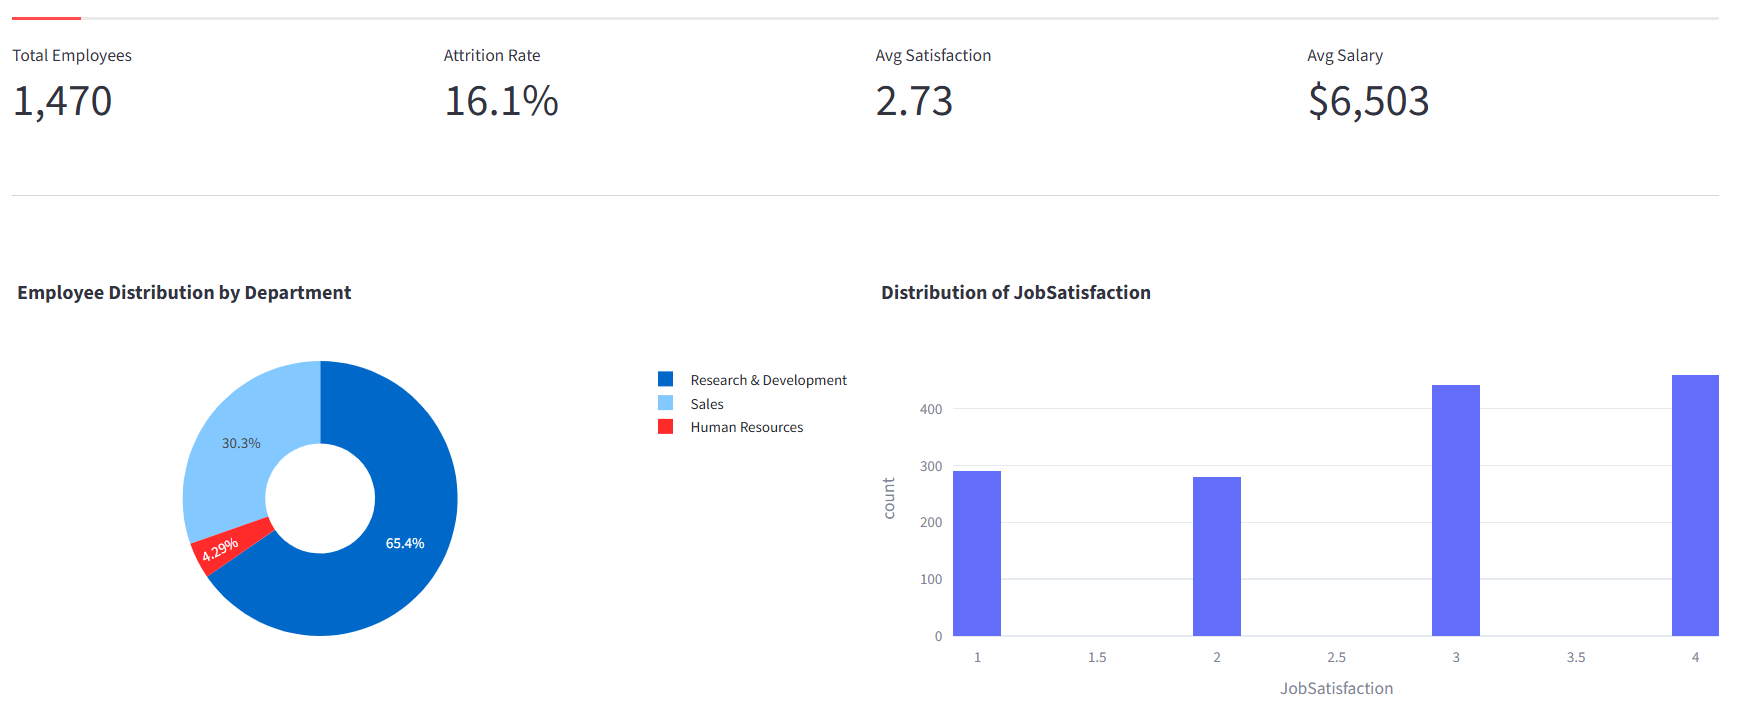
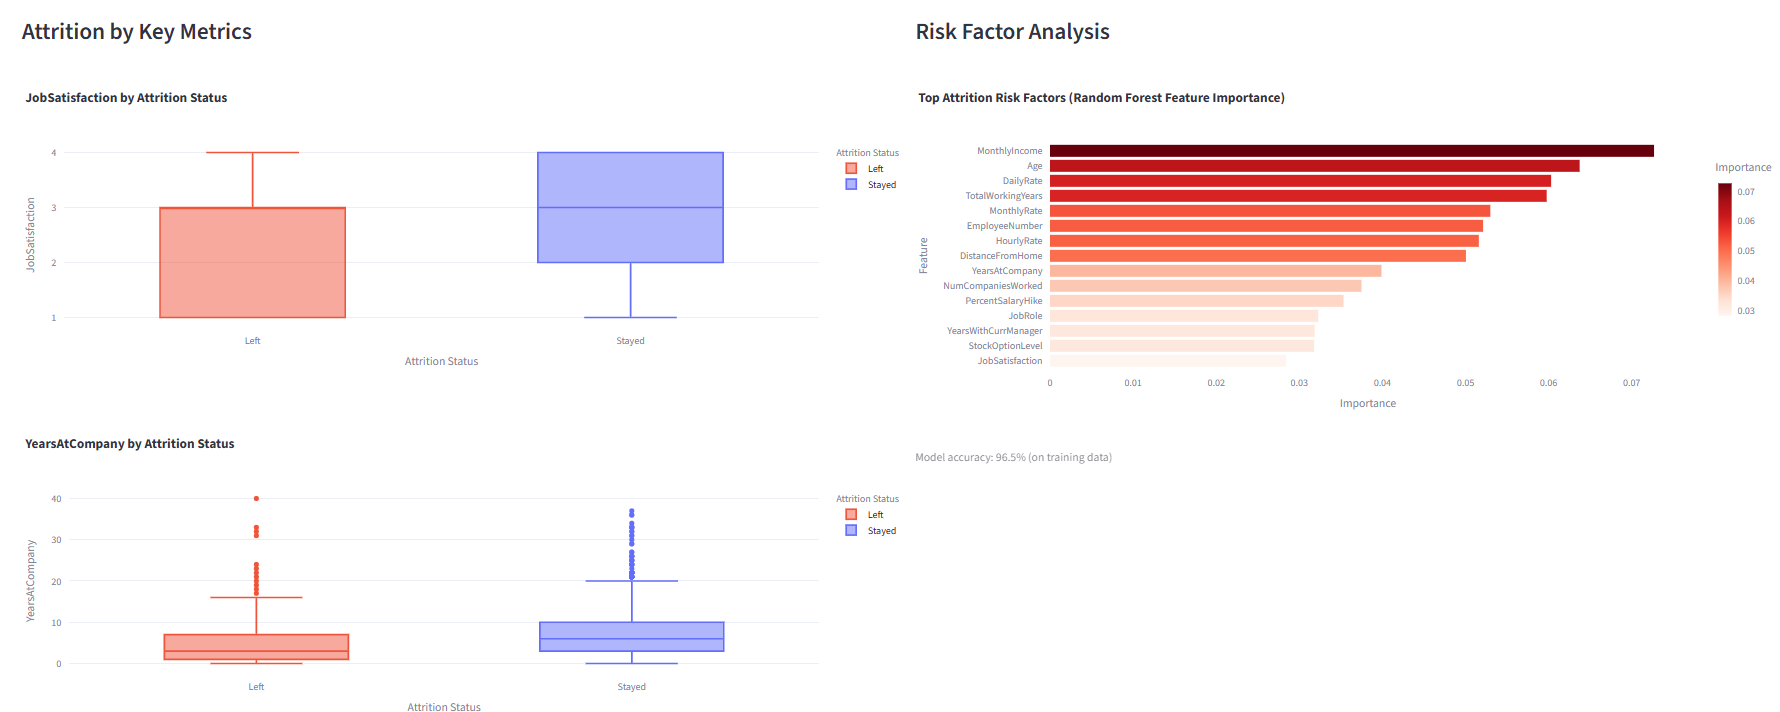
See attrition rates by department, role, and tenure at a glance. Our Random Forest model identifies the top risk factors — whether it's compensation, commute distance, or years with their current manager — so you can intervene before your best people walk out the door.
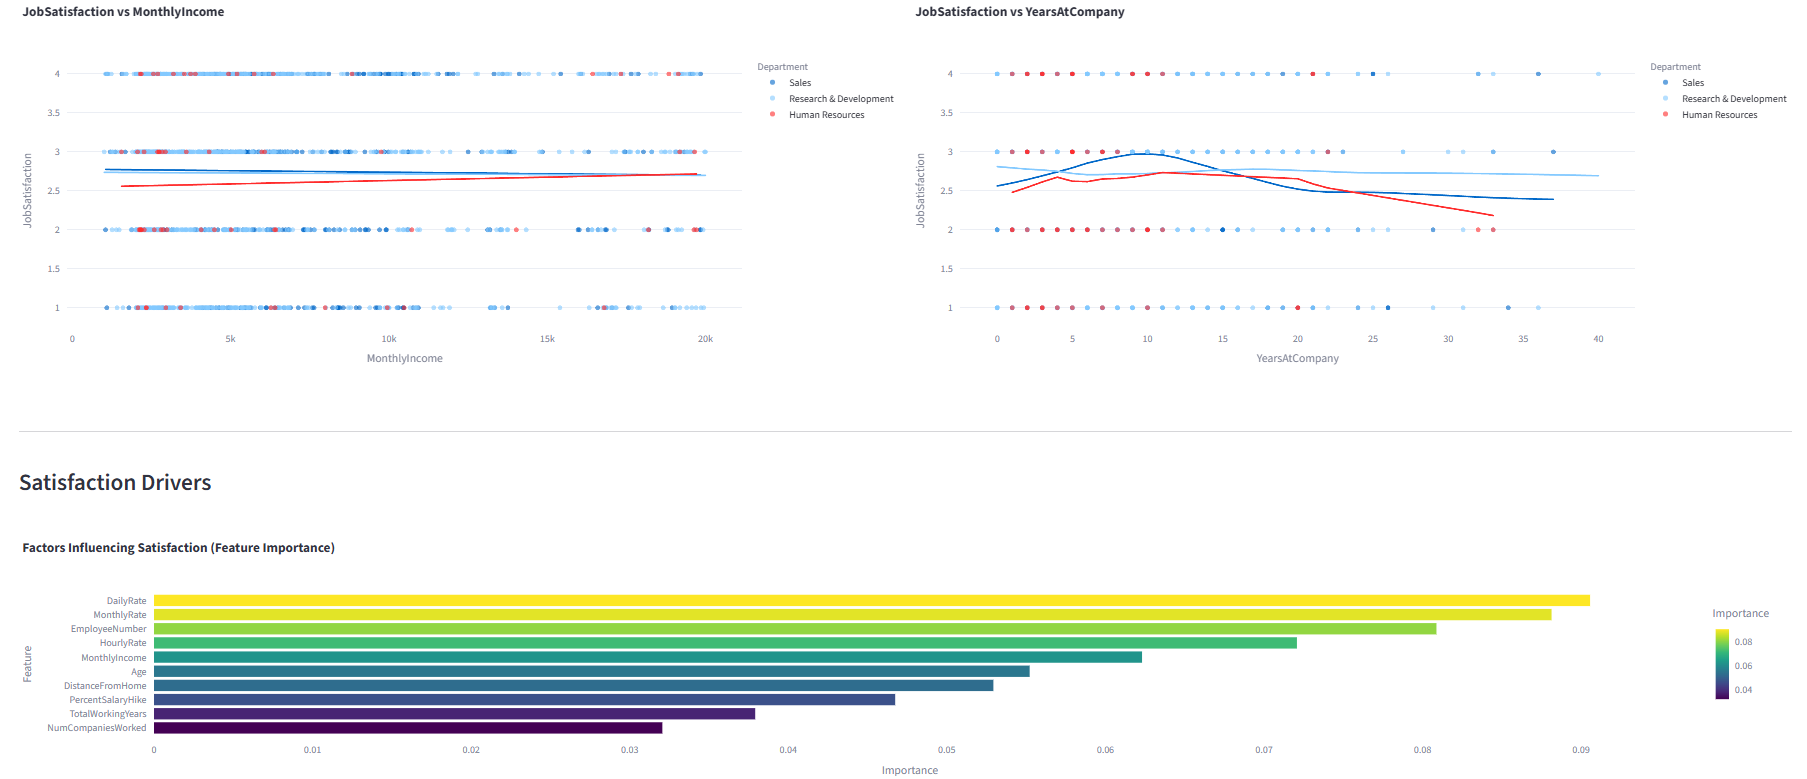
Uncover the relationship between salary, tenure, and job satisfaction across every department. Trendlines and predictive models reveal whether pay raises actually improve engagement — or if other factors matter more.
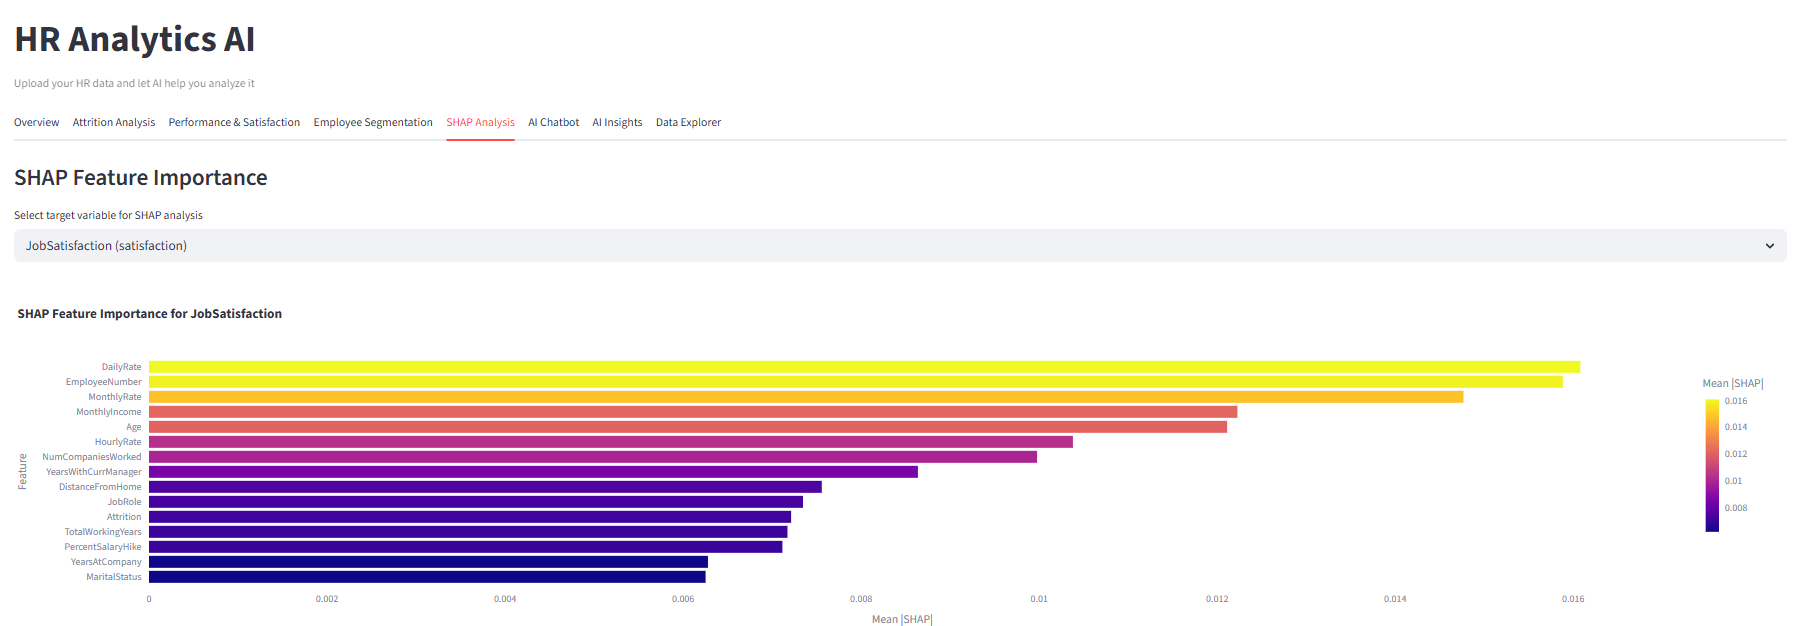
Black-box models don't cut it when you're presenting to the C-suite. SHAP (SHapley Additive exPlanations) values show exactly how much each factor contributes to every prediction — giving you transparent, defensible analytics that executives trust.
Upload any HR dataset — our Azure OpenAI model reads column names, data types, and sample values, then auto-maps them to Salary, Department, Attrition, Tenure, and more. Review and adjust in one click.
K-Means clustering groups employees into meaningful segments. PCA scatter plots visualize each cluster, and profile tables show average salary, tenure, and satisfaction for targeted retention strategies.
Ask in plain English: "What is the attrition rate for Sales?" VivaBoard generates SQL, runs it against your data via DuckDB, and renders the perfect chart — bar, scatter, pie, or metric — automatically.
One click produces executive-ready markdown insights: compensation gaps, retention risks, cluster descriptions like "High performers at risk," and actionable next steps — powered by Azure OpenAI.
No data engineering. No Python notebooks. No waiting for the BI team.
Export a CSV or Excel file from BambooHR, Workday, SAP SuccessFactors, ADP, or any spreadsheet. Drag and drop — that's it.
Azure OpenAI analyzes your column names and sample data, then auto-detects Salary, Department, Attrition, Satisfaction, Tenure, Age, and Job Role. You review and adjust.
Instantly access KPI dashboards, attrition risk factors, satisfaction drivers, employee clusters, SHAP explanations, an AI chatbot, and auto-generated executive insights.
Every plan includes all analytics features. No hidden limits, no per-seat charges.
We support CSV, XLS, and XLSX files. Export from any HRIS (BambooHR, Workday, SAP SuccessFactors, ADP, Gusto), ATS (Greenhouse, Lever), or even a Google Sheet or Excel spreadsheet. If your data has columns like Employee ID, Department, Salary, and Attrition, VivaBoard can analyze it.
When you upload a file, Azure OpenAI analyzes your column names, data types, and a sample of values. It then maps them to HR semantic roles — Salary, Department, Attrition, Satisfaction, Tenure, Age, Job Role — with strict type enforcement. Numeric roles only accept numeric columns, dates only accept date columns. You can review and adjust every mapping before analysis begins.
Yes. Your data is processed in-memory on Azure App Service and is never persisted to disk or shared with third parties. All connections use HTTPS/TLS encryption. We run on Microsoft Azure infrastructure with SOC 2 and ISO 27001 compliance. The AI column detection sends only column names and a small sample to Azure OpenAI — not your full dataset.
Absolutely. There are no annual contracts or cancellation fees. You can cancel, upgrade, or downgrade at any time from the self-service billing portal powered by Stripe. Your access continues until the end of your current billing period.
Both plans include all 11 analytics features — dashboards, attrition analysis, satisfaction modeling, clustering, SHAP, AI chatbot, and AI insights. Professional adds priority support, higher data limits (50,000 rows vs. 10,000), and the ability to connect your HRIS or CRM via API for automated data syncing.
Not at all. VivaBoard was built for HR professionals, not data scientists. Upload your file, let the AI map your columns, and explore the dashboard tabs. The AI Chatbot lets you ask questions in plain English like "What is the average salary by department?" and get instant charts and tables.
Join HR teams at growing companies who use VivaBoard AI to reduce attrition, boost engagement, and make data-driven workforce decisions every day.
Start Your 10-Day Free TrialNo credit card required • All features included • Cancel anytime